



The modern monetary system changed permanently in 1971 when the United States formally ended dollar convertibility into gold under the Bretton Woods framework. Before that shift, foreign governments could exchange U.S. dollars for physical gold through the U.S. Treasury. After President Nixon suspended convertibility, the dollar became a fully fiat currency supported by government credit and central-bank policy rather than direct gold backing.
Since then, the supply of dollars in the financial system has expanded sharply while the purchasing power of the currency steadily declined. During the same period, gold rose from roughly $35 per ounce in the early 1970s to multi-thousand-dollar levels in 2026 trading. 1 2
For many retirement savers and high-net-worth families, the concern is not inflation alone, but whether official inflation data fully reflects the real-world rise in housing, healthcare, energy, and long-term living costs. Gold has historically reacted not only to inflation, but also to debt growth, banking instability, and weakening confidence in fiat currencies.
Key Takeaways:
- Official CPI tracks broad consumer price changes, but critics argue that substitution models and quality adjustments can understate the lived cost pressures facing many households.
- Since 1971, M2 money supply has expanded sharply, while gold bullion has often responded strongly during periods of inflation, monetary stress, and currency weakness.
- Physical bullion differs from bank deposits and paper gold products because it is not a financial institution’s liability, though physical settlement still requires verification, pricing, and transaction procedures.
The Structural Flaws of Official CPI Calculations

The Consumer Price Index remains the primary inflation benchmark used by policymakers, economists, and financial institutions in the United States. Published by the Bureau of Labor Statistics, CPI measures changes in the average price of a weighted basket of consumer goods and services purchased by urban consumers. 3
While CPI remains an important economic indicator, its methodology has evolved significantly over time. The modern framework incorporates substitution effects, geometric weighting, and hedonic quality adjustments designed to account for changes in consumer behavior and product quality.
Critics argue that these same adjustments can soften the reported severity of inflation experienced by households attempting to maintain the same standard of living. CPI may measure broad consumer pricing trends, but it does not fully reflect the rising costs of scarce assets such as residential property in high-demand markets, healthcare, insurance, energy infrastructure, or long-duration retirement expenses.
This distinction is one reason many wealth preservation buyers compare CPI alongside M2 money supply growth and gold bullion performance rather than relying exclusively on headline inflation numbers.
Hedonic Adjustments and Substitution Models: Masking True Wealth Erosion
Hedonic quality adjustment attempts to account for improvements in product quality over time. If a modern television costs more than a television from twenty years ago but offers significantly improved technology, statistical adjustments may reduce the measured inflation impact because the newer product is considered superior in quality.
Substitution models function similarly. If consumers shift from expensive products toward cheaper alternatives, CPI calculations may partially reflect those lower-cost substitutes instead of measuring the cost of maintaining identical consumption patterns.
Critics argue that these adjustments can create a disconnect between official inflation readings and the lived financial experience of many households. A retiree facing rising healthcare costs cannot easily substitute away medical treatment. A family confronting sharply higher housing costs may not view relocation to a cheaper market as preserving the same standard of living.
This debate became especially visible after the inflation cycles of the 1970s and early 1980s, when economists and policymakers revised inflation methodologies in response to criticisms surrounding CPI accuracy and inflation measurement.
Mapping the 50-Year Trajectory: Gold Bullion vs. M2 Supply
One of the clearest ways to examine long-term monetary expansion is through M2 money supply. M2 measures physical currency, checking deposits, savings deposits, money market balances, and related liquid financial assets circulating throughout the economy. 4
Over the past 50 years, the relationship between gold, CPI, and M2 money supply has become central to many wealth preservation discussions. The table below uses consistent end-of-period values only across CPI, M2, and gold prices.
| Period | CPI Start → End | CPI Growth | M2 Start → End | M2 Growth | Gold Start → End | Gold Change | Gold Performance vs. CPI Growth |
| 1976–1985 | 58.400 → 109.500 | 87.5% | 1,152.0 → 2,492.1 | 116.3% | $133.77 → $327.00 | 144.4% | Gold Outpaced CPI Growth by Roughly 56.9 Percentage Points |
| 1986–1995 | 110.800 → 153.900 | 38.9% | 2,728.0 → 3,629.5 | 33.0% | $390.90 → $387.00 | -1.0% | Gold Underperformed CPI During This Lower-Inflation Cycle |
| 1996–2005 | 159.100 → 198.100 | 24.5% | 3,818.6 → 6,687.8 | 75.1% | $369.00 → $513.00 | 39.0% | Gold Exceeded CPI Growth by Approximately 14.5 Percentage Points |
| 2006–2015 | 203.100 → 237.761 | 17.1% | 7,080.1 → 12,387.9 | 75.0% | $635.70 → $1,060.00 | 66.7% | Gold Strongly Outpaced CPI Growth During the Post-2008 Monetary Expansion Period |
| 2016–2026 YTD (CPI/M2 Through Apr. 2026; Gold Through May 2026) | 242.637 → 332.407 | 37.0% | 13,234.9 → 22,804.5 | 72.3% | $1,151.85 → $4,500.40 | 290.7% | Gold Dramatically Exceeded CPI Growth During the Post-2020 Inflation Cycle |
Data note: Percentage changes are calculated using: ((End Value − Start Value) ÷ Start Value) × 100. CPI and M2 values are from FRED. Gold price values are based on historical gold price data and selected end-of-period observations. 5 6
The table shows several important patterns. Gold did not outperform inflation during every decade. The 1986–1995 period demonstrates this clearly, as gold prices remained relatively flat while inflation continued rising. Any serious historical analysis must acknowledge these weaker periods rather than presenting gold as a permanently rising asset.
However, across the broader post-1971 monetary era, physical bullion historically performed strongly during periods of large-scale monetary expansion, negative real interest rates, banking stress, and rising concerns surrounding fiat currency stability.
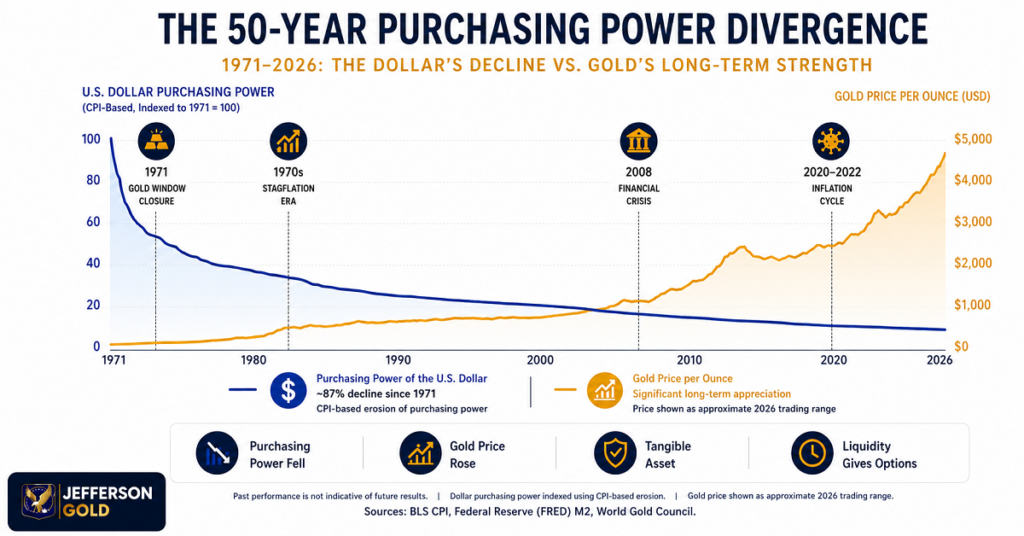
Stagflation, Market Disruptions, and Dollar Devaluation Cycles
The strongest historical case study remains the U.S. stagflation cycle of the 1970s. During this period, the United States experienced high inflation, weak economic growth, rising unemployment, and severe energy shocks following the OPEC oil embargo. Inflation accelerated sharply while economic conditions deteriorated.
Traditional paper assets struggled badly in real terms during much of this decade. Bondholders faced rising inflation that reduced the real value of fixed payments. Equity markets delivered weak inflation-adjusted performance for extended periods. Mortgage rates eventually climbed above 18% in 1981 as policymakers aggressively raised rates in an attempt to contain inflation. 7
Gold behaved very differently. After trading near $35 per ounce during the Bretton Woods period, gold surged to approximately $850 per ounce by January 1980. Even after adjusting for inflation, the increase remained historically significant. 8
This period remains historically important because it demonstrated how physical bullion can react during prolonged monetary stress, negative real interest rates, and declining confidence in fiat systems.
Why Physical Bullion Displaces Paper Liabilities in Capital Preservation
Bank deposits are often viewed as cash sitting safely inside a vault. Structurally, however, deposited funds become liabilities of the institution holding them within the commercial banking framework.
For ordinary households operating within FDIC insurance limits, this structure may not appear immediately concerning. High-net-worth families and wealth preservation buyers often think differently because larger balances create greater exposure to systemic liquidity disruptions, banking instability, and currency debasement.
Physical bullion differs structurally from paper claims.
A gold bar or coin owned directly or held through allocated storage represents a tangible asset rather than a digital claim against a financial institution. It does not depend on corporate earnings, lending markets, derivatives exposure, or bank solvency in the same way conventional financial assets do.
Periods of banking instability, including the 2008 financial crisis and portions of the 2023 regional banking turmoil, were accompanied by stronger interest in gold and other perceived safe-haven assets. 9 10
Understanding Market Liquidity and Physical Settlement Protocols

Gold remains one of the world’s most recognized monetary assets. Central banks continue holding gold reserves, sovereign mints continue producing bullion products, and active precious-metals markets operate across major financial centers.
At the same time, physical gold liquidation should not be described as instant or frictionless. Settlement timelines depend on dealer availability, authentication procedures, product recognition, vault access, transportation logistics, market hours, and prevailing bid-ask spreads.
Smaller denomination products are often easier to liquidate incrementally than large hard assets such as commercial property or farmland. However, all physical bullion transactions follow standard verification and settlement procedures designed to protect both buyers and dealers.
Gold’s long-term strength does not come from unrealistic promises of immediate liquidity. Its strength comes from scarcity, global recognition, portability, and its historical role outside the traditional paper-currency system.
Strategic Close
The historical record since 1971 reveals a consistent long-term pattern. Fiat currencies lose purchasing power over time when money supply expansion persistently outpaces the growth of scarce assets and productive economic output. CPI measures part of this process, but many critics argue it does not fully reflect the practical erosion experienced across housing, healthcare, energy, and long-term wealth preservation costs.
Gold does not rise every year, and it does not outperform every financial asset during every cycle. However, across multiple decades of monetary expansion, inflationary pressure, banking instability, and rising sovereign debt levels, physical bullion has repeatedly acted as a monetary counterweight to weakening currency purchasing power.
This is why gold bullion vs inflation history continues attracting attention in 2026. For families focused on preserving purchasing power across generations, the question extends beyond short-term price movement. The deeper issue is whether wealth held entirely inside paper financial systems remains protected during periods of structural monetary change.
Jefferson Gold helps customers learn about physical gold and silver ownership, including direct delivery options and precious metals IRA structures that involve approved custodians and eligible storage arrangements. Buyers can ask questions about product types, verification procedures, pricing structures, storage requirements, and settlement mechanics without pressure or unrealistic promises.